
The Stackhouse Agency, LLC has created a chart with February 24, 2021 U.S. coronavirus cases. The chart includes the number of U.S. coronavirus cases, Percentage Difference, and Percentage Change.

The Stackhouse Agency, LLC has created a chart with February 17, 2021 U.S. coronavirus cases. The chart includes the number of U.S. coronavirus cases, Percentage Difference, and Percentage Change.

The Stackhouse Agency, LLC has created a chart with February 10, 2021 U.S. coronavirus cases. The chart includes the number of U.S. coronavirus cases, Percentage Difference, and Percentage Change.

The Stackhouse Agency, LLC has created a chart with February 3, 2021 U.S. coronavirus cases. The chart includes the number of U.S. coronavirus cases, Percentage Difference, and Percentage Change.

The Stackhouse Agency, LLC has created a chart with January 27, 2021 U.S. coronavirus cases. The chart includes the number of U.S. coronavirus cases, Percentage Difference, and Percentage Change.

The Stackhouse Agency, LLC has created a chart with January 20, 2021 U.S. coronavirus cases. The chart includes the number of U.S. coronavirus cases, Percentage Difference, and Percentage Change.

The Stackhouse Agency, LLC has created a chart with January 13, 2021 U.S. coronavirus cases. The chart includes the number of U.S. coronavirus cases, Percentage Difference, and Percentage Change.

The Stackhouse Agency, LLC has created a chart with January 6, 2021 U.S. coronavirus cases. The chart includes the number of U.S. coronavirus cases, Percentage Difference, and Percentage Change.

The Stackhouse Agency, LLC has created a chart with December 30, 2020 U.S. coronavirus cases. The chart includes the number of U.S. coronavirus cases, Percentage Difference, and Percentage Change.

The Stackhouse Agency, LLC has created a chart with December 23, 2020 U.S. coronavirus cases. The chart includes the number of U.S. coronavirus cases, Percentage Difference, and Percentage Change.

The Stackhouse Agency, LLC has created a chart with December 16, 2020 U.S. coronavirus cases. The chart includes the number of U.S. coronavirus cases, Percentage Difference, and Percentage Change.

The Stackhouse Agency, LLC has created a chart with December 9, 2020 U.S. coronavirus cases. The chart includes the number of U.S. coronavirus cases, Percentage Difference, and Percentage Change.

The Stackhouse Agency, LLC has created a chart with December 2, 2020 U.S. coronavirus cases. The chart includes the number of U.S. coronavirus cases, Percentage Difference, and Percentage Change.

The Stackhouse Agency, LLC has created a chart with November 25, 2020 U.S. coronavirus cases. The chart (*spacing) includes the number of U.S. coronavirus cases, Percentage Difference, and Percentage Change.

The Stackhouse Agency, LLC has created a chart with November 25, 2020 U.S. coronavirus cases. The chart includes the number of U.S. coronavirus cases, Percentage Difference, and Percentage Change.

The Stackhouse Agency, LLC has created a chart with November 18, 2020 U.S. coronavirus cases. The chart includes the number of U.S. coronavirus cases, Percentage Difference, and Percentage Change.

The Stackhouse Agency, LLC has created a chart with November 11, 2020 U.S. coronavirus cases. The chart includes the number of U.S. coronavirus cases, Percentage Difference, and Percentage Change.

The Stackhouse Agency, LLC has created a chart with November 4, 2020 U.S. coronavirus cases. The chart includes the number of U.S. coronavirus cases, Percentage Difference, and Percentage Change.

The Stackhouse Agency, LLC has created a chart with October 28, 2020 U.S. coronavirus cases. The chart includes the number of U.S. coronavirus cases, Percentage Difference, and Percentage Change.

The Stackhouse Agency, LLC has created a chart with October 21, 2020 U.S. coronavirus cases. The chart includes the number of U.S. coronavirus cases, Percentage Difference, and Percentage Change.

The Stackhouse Agency, LLC has created a chart with October 14, 2020 U.S. coronavirus cases. The chart includes the number of U.S. coronavirus cases, Percentage Difference, and Percentage Change.

The Stackhouse Agency, LLC has created a chart with October 7, 2020 U.S. coronavirus cases. The chart includes the number of U.S. coronavirus cases, Percentage Difference, and Percentage Change.

The Stackhouse Agency, LLC has created a chart with September 30, 2020 U.S. coronavirus cases. The chart includes the number of U.S. coronavirus cases, Percentage Difference, and Percentage Change.

The Stackhouse Agency, LLC has created a chart with September 23, 2020 U.S. coronavirus cases. The chart includes the number of U.S. coronavirus cases, Percentage Difference, and Percentage Change.

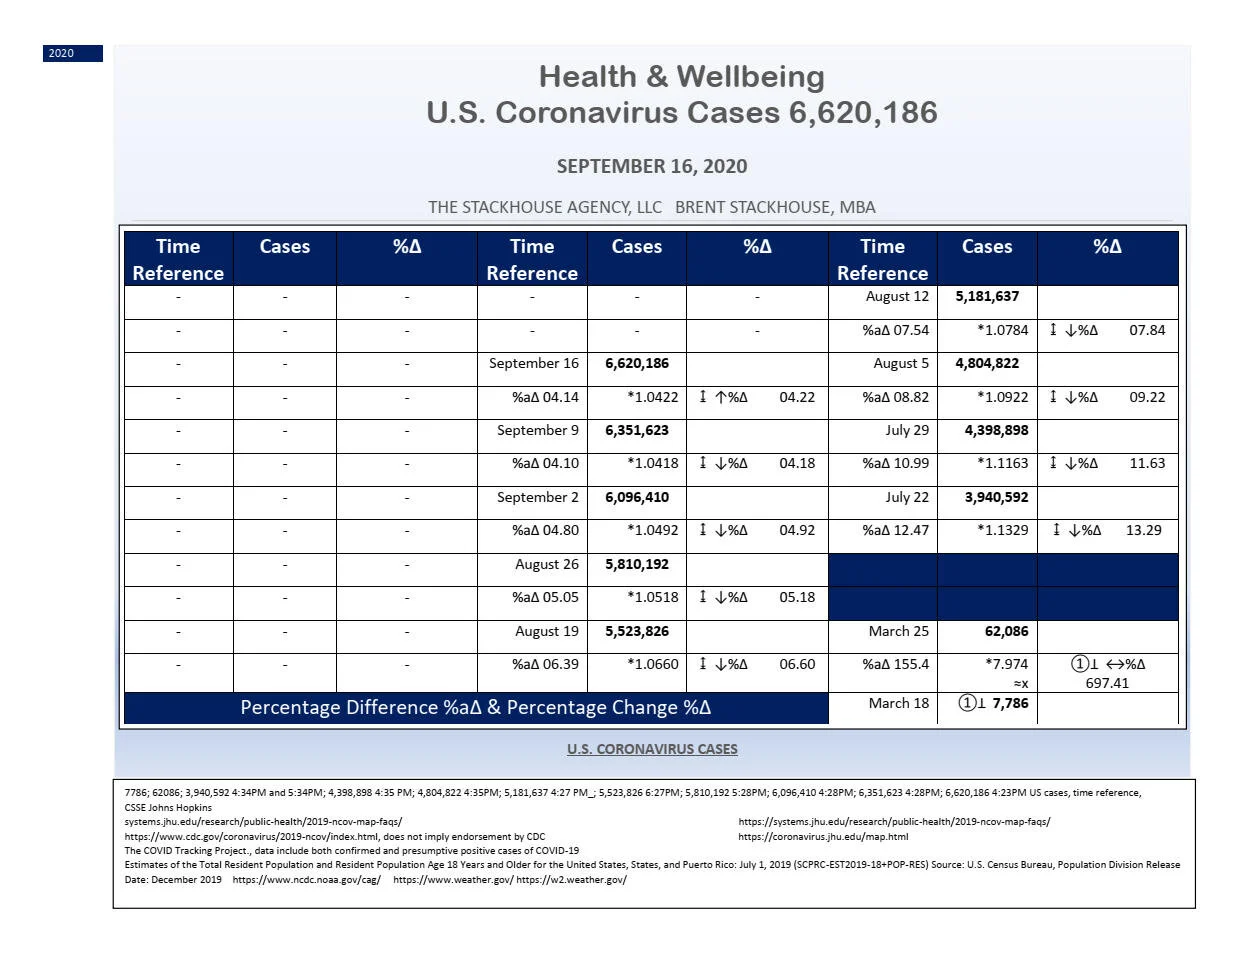
The Stackhouse Agency, LLC has created a chart with September 16, 2020 U.S. coronavirus cases. The chart includes the number of U.S. coronavirus cases, Percentage Difference, and Percentage Change.
The Stackhouse Agency, LLC has created a chart with September 9, 2020 U.S. coronavirus cases. The chart includes the number of U.S. coronavirus cases, Percentage Difference, and Percentage Change.

The Stackhouse Agency, LLC has created a chart with September 2, 2020 U.S. coronavirus cases. The chart includes the number of U.S. coronavirus cases, Percentage Difference, and Percentage Change.


The Stackhouse Agency, LLC has created a chart with August 26, 2020 U.S. coronavirus cases. The chart includes the number of U.S. coronavirus cases, Percentage Difference, and Percentage Change.

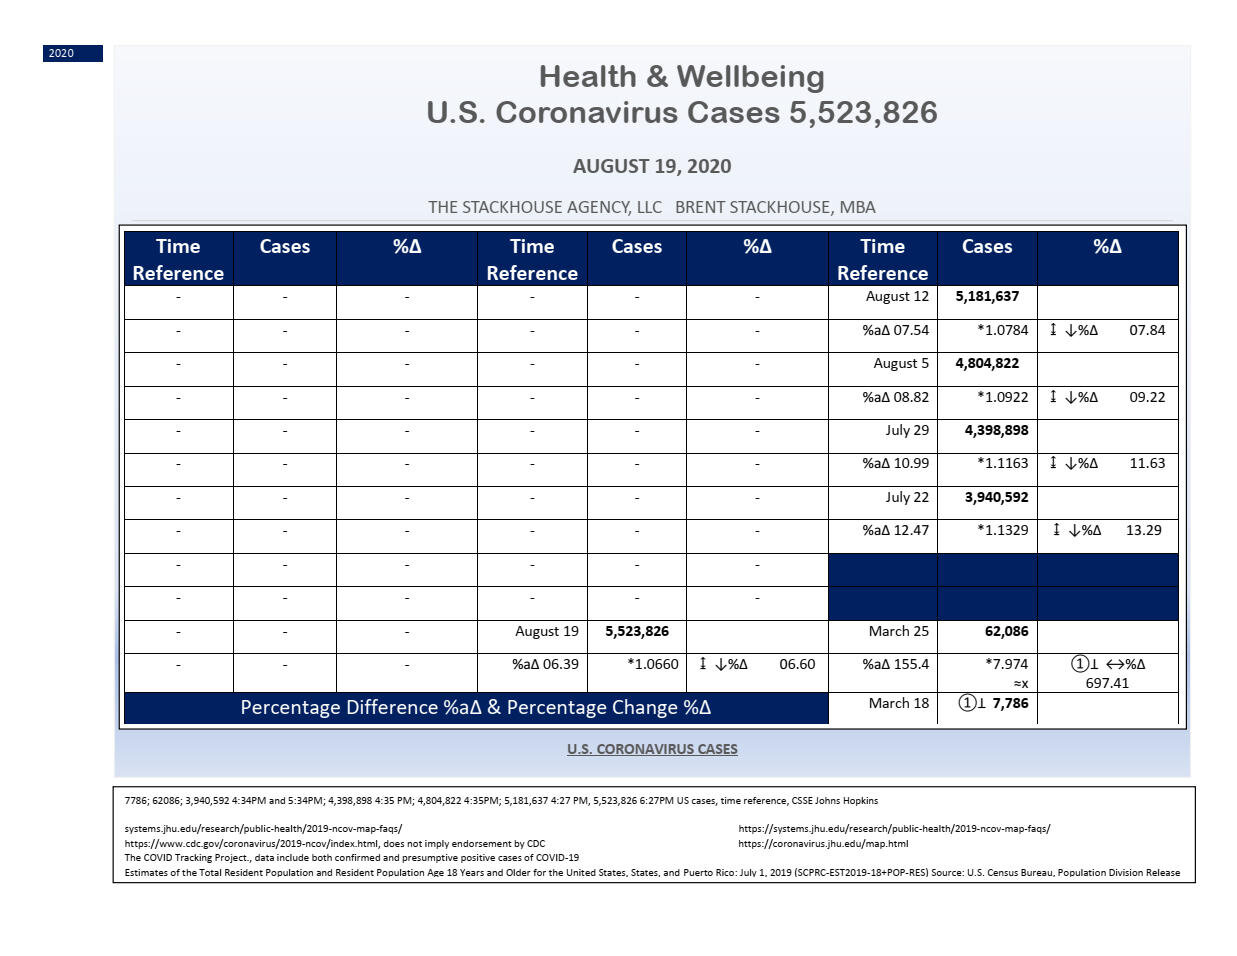
The Stackhouse Agency, LLC has created a chart with August 19, 2020 U.S. coronavirus cases. The chart includes the number of U.S. coronavirus cases, Percentage Difference, and Percentage Change.
Top Smartphone Companies by Active Devices (Locations)
August 15, 2020 GDP heat maps for 2018 and 2019 have been included on the StackhouseAgency.com site. 🖱 ⌨
August 14, 2020 GDP is an important topic in the (overall) discipline of wellbeing. GDP may shape how wellbeing measures are considered or utilized. The topic of GDP has important implications during the (coronavirus) pandemic. 🖱 ⌨
The Stackhouse Agency, LLC has created a chart with August 12, 2020 U.S. coronavirus cases. The chart includes the number of U.S. coronavirus cases, Percentage Difference, and Percentage Change.

The Stackhouse Agency, LLC has created a chart with August 5, 2020 U.S. coronavirus cases. The chart includes the number of U.S. coronavirus cases, Percentage Difference, and Percentage Change.

The Stackhouse Agency, LLC has created a chart with July 29, 2020 U.S. coronavirus cases. The chart includes the number of U.S. coronavirus cases, Percentage Difference, and Percentage Change.

The Stackhouse Agency, LLC has created a chart with July 22, 2020 U.S. coronavirus cases. The chart includes the number of U.S. coronavirus cases, Percentage Difference, and Percentage Change.

The Stackhouse Agency, LLC has created a chart with July 15, 2020 U.S. coronavirus cases. The chart includes the number of U.S. coronavirus cases, Percentage Difference, and Percentage Change.

The Stackhouse Agency, LLC has created a chart with July 8, 2020 U.S. coronavirus cases. The chart includes the number of U.S. coronavirus cases, Percentage Difference, and Percentage Change.

The Stackhouse Agency, LLC has created a chart with July 1, 2020 U.S. coronavirus cases. The chart includes the number of U.S. coronavirus cases, Percentage Difference, and Percentage Change.

The Stackhouse Agency, LLC has created a chart with June 24, 2020 U.S. coronavirus cases. The chart includes the number of U.S. coronavirus cases, Percentage Difference, and Percentage Change.

The Stackhouse Agency, LLC has created a chart with June 17, 2020 U.S. coronavirus cases. The chart includes the number of U.S. coronavirus cases, Percentage Difference, and Percentage Change.

The Stackhouse Agency, LLC has created a chart with June 10, 2020 U.S. coronavirus cases. The chart includes the number of U.S. coronavirus cases, Percentage Difference, and Percentage Change.

The Stackhouse Agency, LLC has created a chart with June 3, 2020 U.S. coronavirus cases. The chart includes the number of U.S. coronavirus cases, Percentage Difference, and Percentage Change.

The Stackhouse Agency, LLC has created a chart with May 27, 2020 U.S. coronavirus cases. The chart includes the number of U.S. coronavirus cases, Percentage Difference, and Percentage Change.

The Stackhouse Agency, LLC has created a chart with May 20, 2020 U.S. coronavirus cases. The chart includes the number of U.S. coronavirus cases, Percentage Difference, and Percentage Change.

The Stackhouse Agency, LLC has created a chart with May 13, 2020 U.S. coronavirus cases. The chart includes the number of U.S. coronavirus cases, Percentage Difference, and Percentage Change. The Stackhouse Agency, LLC has included a graph for data quality assurance purposes in consideration of precision, decimal places, and trends in the chart.

2020 Health & Wellbeing
The Stackhouse Agency, LLC has created a chart with May 6, 2020 U.S. coronavirus cases. The chart includes the number of U.S. coronavirus cases, Percentage Difference, and Percentage Change.

2020 Health & Wellbeing
The Stackhouse Agency, LLC has created a chart with April 29, 2020 U.S. coronavirus cases. The chart includes the number of U.S. coronavirus cases, Percentage Difference, and Percentage Change.

2020 Health & Wellbeing
The Stackhouse Agency, LLC has created a chart with April 22, 2020 U.S. coronavirus cases. The chart includes the number of U.S. coronavirus cases, Percentage Difference, and Percentage Change.

2020 Health & Wellbeing
The Stackhouse Agency, LLC has created a chart with April 15, 2020 U.S. coronavirus cases. The chart includes the number of U.S. coronavirus cases, Percentage Difference, and Percentage Change.

2020 Health & Wellbeing
The Stackhouse Agency, LLC has created a reference with April 8, 2020 U.S. coronavirus cases.

2020 Health & Wellbeing
The Stackhouse Agency, LLC has created a chart with April 1, 2020 U.S. coronavirus cases. The upper bound number of cases, state population numbers, and mean temperatures for January and February 2020 are included (in consideration of 215,417 cases).

2020 Health & Wellbeing
The Stackhouse Agency, LLC has created a chart with March 25, 2020 U.S. coronavirus cases. The upper bound number of cases, state population numbers, and mean temperatures for January and February 2020 are included (in consideration of 62,086 cases).

2020 Health & Wellbeing
The Stackhouse Agency, LLC has created a chart with March 18, 2020 U.S. coronavirus cases. The upper bound number of cases, state population numbers, and mean temperatures for January and February 2020 are included (in consideration of 7,786 cases).

The Intersection of Technology and Human Interaction
January 18, 2020
Brent Stackhouse, MBA


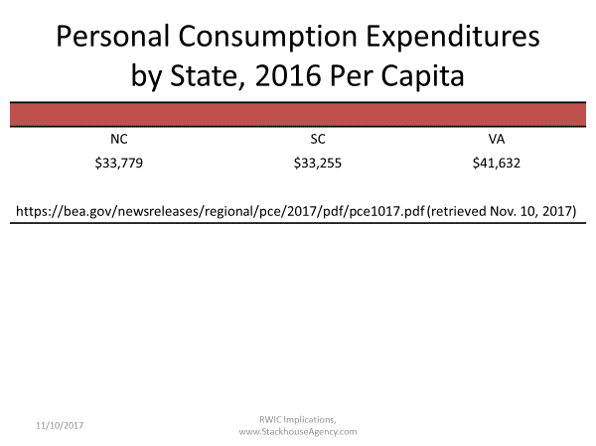
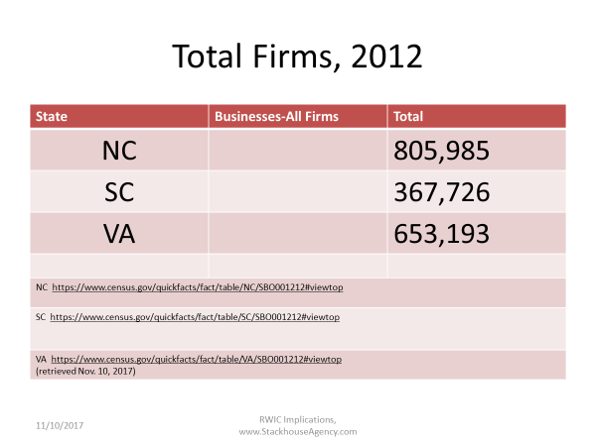
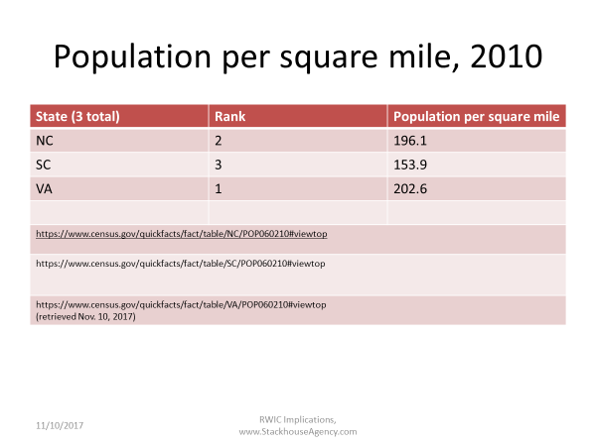
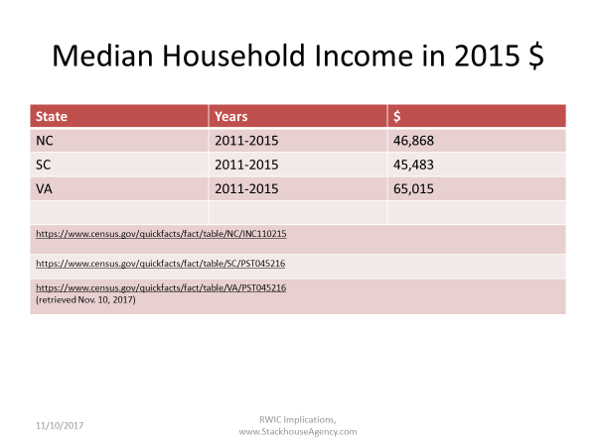
Regional Workforce Considerations

EMPLOYEE ENGAGEMENT, behavioral econ, wellbeing 2016
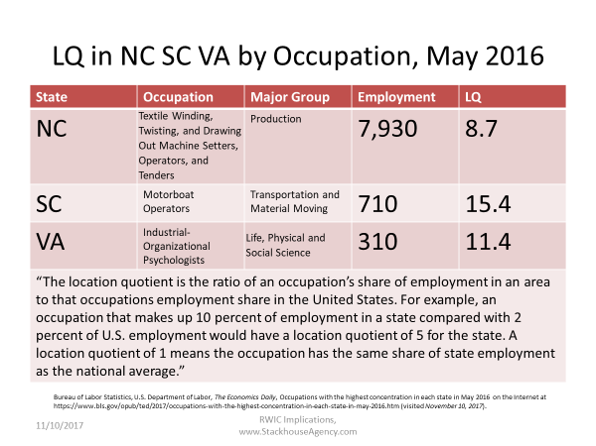
The Stackhouse Agency, LLC continued its work in a new North Carolina location. The Research Triangle area and other regional resources have been beneficial.
EMPLOYEE ENGAGEMENT 2014, 2015, 2016
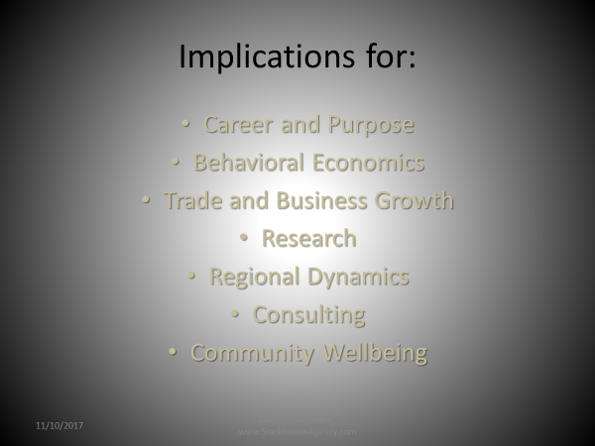
The Stackhouse Agency, LLC has recently worked on projects related with Employee Engagement. Organizations measure engagement in various ways. Research was completed to determine how organizations define employee engagement and the prevailing tools for measuring engagement in the workforce. Research included international components of employee engagement in addition to research about employee engagement in the United States. Emphasis was upon government employees and any associations with employee engagement in the business sector. Main work areas: Research, Presentations, Analysis.
The Stackhouse Agency, LLC has also worked on projects related with research, business/organizational dynamics, and business opportunities.
The Stackhouse Agency, LLC has been conducting research that can be utilized in areas benefiting from studies in behavioral economics.
2015 CONSIDERATIONS REPORT
The Stackhouse Agency, LLC
October 2015 Considerations Report - (online post November 21, 2015)
ABOUT OUR FIRM
Founded Spring 2014 - Olathe, Kansas
Articles of Organization: State of Kansas, Limited Liability Company
Form of Business: Consultancy - Project Management, Process Administration, Research, Analysis, Reports/Writing
Leadership: Brent Stackhouse, MBA - Founder & Consultancy Firm Manager
LEADERSHIP
Brent Stackhouse, MBA
BA, Int'l Relations, William & Mary
MBA, Management, Troy University
Legal Admin. Studies, University of Virginia SCPS 2004
Research Seminar, Duke University School of Medicine 2013
CPE Credits
Johnson County, KS resident & author
FINANCING
Our Consultancy is a Limited Liability Company. We are not a publicly-traded company. We understand our role as a startup company and the options for financing available. We have decided to implement content and continue with research/projects prior to larger loan financing decisions.
LOCATION/TAXES
Our Consultancy continues to look at the way in which regulation may impact our business. Taxation, company structure, zoning, and access to markets have been major considerations since the founding of our firm. 2015 State tax changes were updated within our Firm's business operations.
EMPLOYMENT
Our Consultancy offers opportunities for independent contributors for select projects. Our firm actively participates in organizational effectiveness. Brent Stackhouse, Consultancy Firm Manager, has completed CPE for credit in 2015 in the areas if FLSA, HR, and workforce considerations. Brent Stackhouse has also formally completed prior HR & Organizational coursework for credit.
Some Stackhouse Agency, LLC content is readily available from our online shop page. Please contact our Firm for additional services and fees.
2015 ACCOMPLISHEMENTS & ACTIVITIES
2nd-Year Membership in the Olathe Chamber of Commerce
Participation in the first-annual Techweek Kansas City
An e-commerce shop page was added to the StackhouseAgency.com site
New content was added to the StackhouseAgency.com site
Brent Stackhouse has attended in-person meetings and utilized social media in addition to participating in other networking opportunities
Brent Stackhouse has completed additional CPE credits for business implementation and personal improvement
2015 WORK AREAS
Behavioral Economics
Well-being
Employee Engagement
Motivation/Social Considerations
Market Considerations/Labor/Work
Skills/Workforce/Potential
General Reports
OUR PRODUCTS AND SERVICES
www.StackhouseAgency.com/shop
Our Products & Services
Examples:
Well-Being/Potential
Research
Behavioral Economics
Business/Organizational Dynamics
Workforce/Social Considerations
OUR STRENGTHS AS A CONSULTANCY FIRM
STRENGTHS
Business Model: Meets Needs, Time Horizon, Efficiencies, Nimble Org.
Research Network: Leverage for Growth, Data, Market Position, Trends
Tech Presence: Value-Driven Business Segment, Process Efficiencies, ROI, Flexibility, Sustained Value
2015 CONSIDERATIONS & FILING PREPARATION
Our Firm works within a few time-measurement considerations
Objectives prior to 2015 year-end:
Filing Preparation
Research
Site Content
Our Firm Thanks you for your Support & Consideration!
The Stackhouse Agency, LLC